
BUYING THE DIPS Made Simple
#Blackrock #Forex #trading #currency #money #scalping #Gold #oil #S&P500 #APPLE #winning with wall street #Wiley

Buying dips can be tricky, the issue is knowing if it's an actual dip or a full trend reversal. I used to think buying at a lower price to double down on an investment going the wrong way was a good idea. However, after reading a book called the Zurich Axioms by Max Gunther - the penny actually dropped. In essence, profit is profit. It does not have to be made from a stock or instrument that you are currently losing. Know when to run, when to cut losses and when to stick with it. Unfortunately by the time you understand true hedging techniques, you will be too late.
Kenny Rogers said it best - "You've got to know when to hold 'em, Know when to fold 'em, Know when to walk away, And know when to run"
I highly recommend both the Zurich Axioms book and a listen to Kenny Rogers - The Gambler.
The logic behind buying the dips
🍒 Buying the dips refers to going long an asset or security after its price has experienced a short-term decline, in repeated fashion.
🍒 Buying the dips can be profitable in long-term uptrends, but unprofitable or tougher during secular downtrends.
🍒 Dip buying can lower one's average cost of owning a position, but the risk and reward of dip-buying should be constantly evaluated.
Simple Ideas for buying dips

You will see in this image RSI and MACD have different ideas - there is no wrong or right, it's up to you to work on the things that work for you. However, you don't want tools that either do more or less the same thing or conflict. So as per the first image - using a moving average for (up or downtrend) this could be a larger period such as a 200.
Envelopes
Utilizing envelopes of sorts will help visualize channels - this could be tools such as Bollinger Bands or Regression channels. Much like Moving averages - you won't need both and there are thousands of tools I have not used. So you need to experiment with something that you like or suits your needs and style.


Like all trading strategies, buying the dips does not guarantee profits. An asset can drop for many reasons, including changes to its underlying value. Just because the price is cheaper than before doesn't necessarily mean the asset represents good value.

Trend lines can be very subjective and educators and mentors teach them in a million different ways. They can be used, but again - back test and find what works for you.

- you can see the difference between a simple trend line and conflict with Bollinger; this is what causes doubt. The subjective trendline says one thing and the calculated/measured tool says another. Which do you follow?
The problem is that the average investor has very little ability to distinguish between a temporary drop in price and a warning signal that prices are about to go much lower. While there may be unrecognized intrinsic value, buying additional shares simply to lower an average cost of ownership may not be a good reason to increase the percentage of the investor's portfolio exposed to the price action of that one stock. (Investopedia)
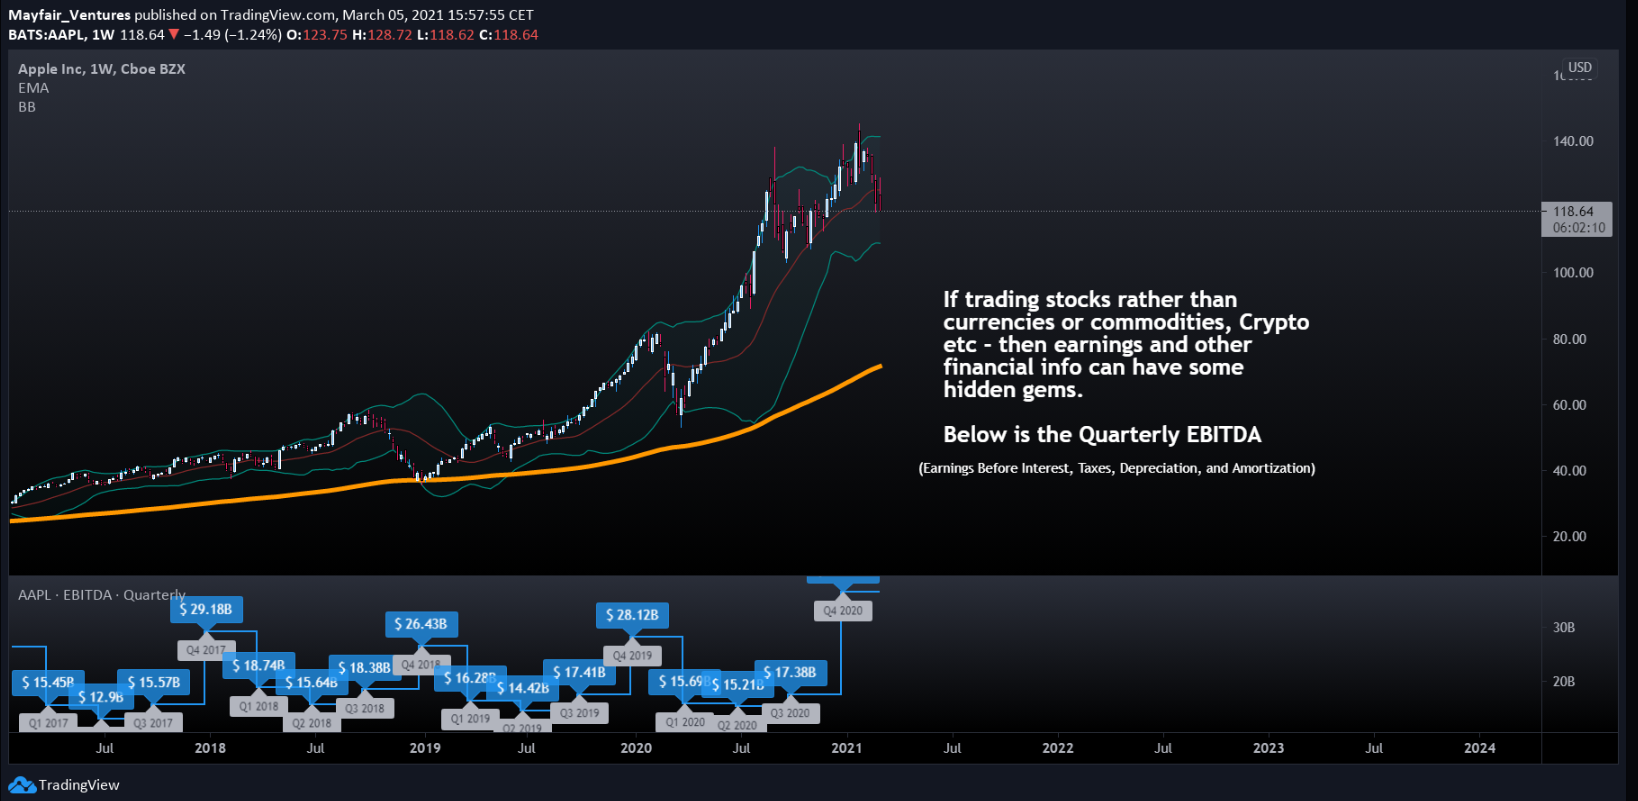
🎲 If trading stocks there are other tools available that are not accessible in trading currencies or other instruments - things like EBITDA or P&L sheets to give further confirmation of continuation in the trend.
ISSUES
As many new traders don't yet understand the losses are part and parcel of trading, seeing your account in red plays on the human emotions (we have all been there) and this makes us do crazy things - doubling down on trades, adding more money to avoid margin calls, buying into a losing trade again and again.

I wrote an idea recently on how the mindset is represented on a chart.

Simplicity
You can use simple price action to spot key levels - over the years one thing I have found is levels such as Order Blocks and imbalances. Plenty of info online for this - no need to go into here, save for another post,

Then when combined with regression channels you can start to paint "expected" levels of interest.

Just to show an example I have added EMA, Bollinger, Hand drawn regression and an imbalance level.

🔢Elliott Wave Theory🔠
Another awesome tool for finding directional bias - If combined with other techniques, indicators and tools, this can be mighty powerful as a whole.

A simple explanation of Elliott wave from another previous post (click for post) -

In Summary - you need a belief and a reason that you assume the stock is going higher. It does not matter if it's SPX, Bitcoin or Apple. Secondary you need a directional bias confirmation such as a 200 EMA. I would say to include an envelope (channel) of some description, Something to help you confirm the trend (Elliott) for example. And then a trigger, this could be a candlestick formation, an RSI or MACD overbought/sold signal. Something that suits you and your style.

I hope this helps. Be great to get other ideas, comments or strategies from others below!
Have a great weekend!